 |
||
|
|||
|
 |
|
|
|
|||
|
|||
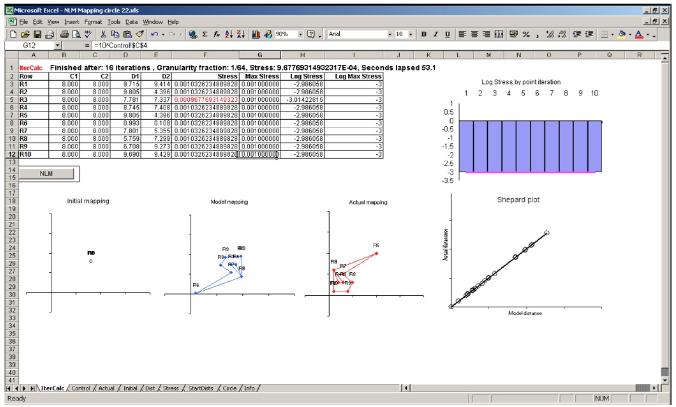
Introduction The link on this page enables you to download an MS Excel file which demonstrates the principles of non-linear mapping.The demonstration software allows the user to provide the coordinates of exactly ten stations. The software then calculates the distances between all the stations and using only this distance information to attempts to create a map of the original layout so that the modeled solution can be visually compared with the actual station layout. The illustration below shows the main display of the software with a table of the calculation status, a couple of graphs of the model stress on the right and three maps at the bottom left. The first map shows the model start point which in this case is all stations stacked on the same point from which the model redistributes the stations to the final solution shown in the second map. The third map is the actual map with which the user can compare the model solution. In this example it can be seen that the model has found a (mirror image) good solution within a run time of less than a minute. |
||||||
 |
||